Overview
It is often said that 80% of data analysis is spent on the process of cleaning and preparing the data. - Hadley Wickham, Chief Scientist at RStudio
Why Oikolab?
Data scientists or analysts often spend days or weeks looking for and processing historical weather data before they can begin their analysis. Here’s where Oikolab comes in – we do the work, so you don’t have to. We save you the most valuable, scarce, and non-renewable resource in the world – your time.
Oikolab has post-processed hundreds of terabytes of weather data that you can access in seconds - whether you require 1 month or 80 years of weather data, downloadable in JSON, CSV or NetCDF format.
Climate & Weather Data for Experts and Researchers
Oikolab data is used by climate and data experts in various industries as well as academic researchers.
Selection of Research Papers using Oikolab as Weather Data source
- Large-scale geothermal collector systems as a heat source for 5GDHC in the U.S. – A case study of three different cities and climate conditions, Zeh et al. (2025)
- Habitat and Predator Influences on the Spatial Ecology of Nine-Banded Armadillos, Lonsinger et al. (2025)
- Cost-effective planning of decarbonized power-gas infrastructure to meet the challenges of heating electrification, Khorramfar et al. (2025)
- A data-driven building thermal zoning algorithm for digital twin-enabled advanced control, Morkunaite et al. (2025)
- Energy Potential of Existing Reversible Air-to-Air Heat Pumps for Residential Heating, Murano et al. (2024)
- Climate Mitigation Strategies: The Use of Cool Pavements, Giorio & Paparella (2023)
- Time-Use Data Modelling of Domestic, Commercial and Industrial Electricity Demand for the Scottish Islands, Matthew & Spataru (2023)
- Forecasting the Monash Microgrid for the IEEE-CIS Technical Challenge, Bean (2023)
If you are a researcher in need of high-quality weather and climate data, we’d be happy to help — please feel free to reach out!
Global Datasets
We provide post-processed datasets from national weather agencies such as NCEP/NOAA, ECMWF, and Environment Canada for fast access to historical reanalysis and forecast data.
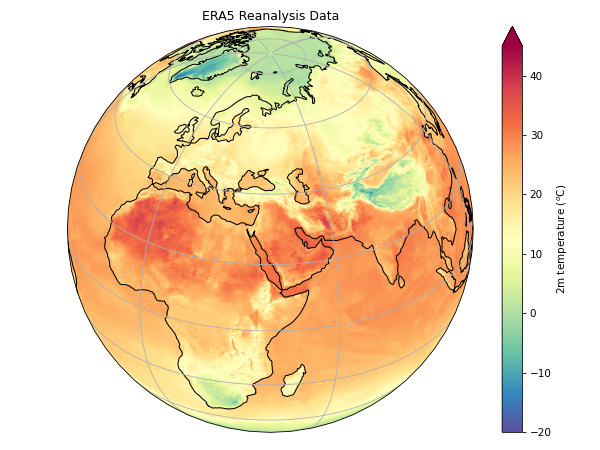
ERA5 is the latest generation of the reanalysis dataset produced by the Copernicus Climate Change Service (C3S implemented by ECMWF) and is the main dataset that we use for historical data. Data is available from 1940 to present with a 5-day delay, updated around 12 UTC daily. DOI: 10.24381/cds.adbb2d47
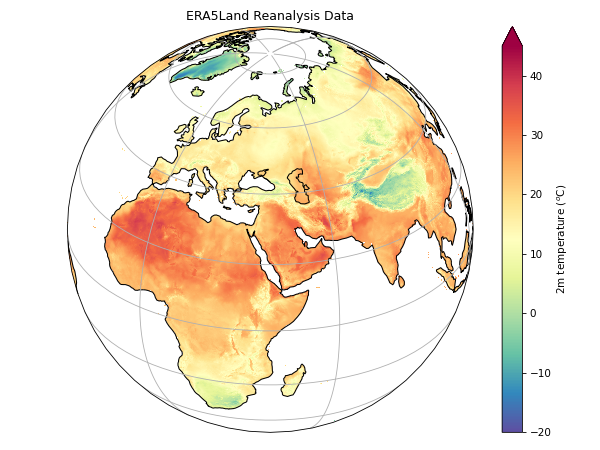
ERA5Land dataset provides higher resolution (9km) than the ERA5 dataset for a selected set of surface parameters. Data is available from 1950 to present with a 5-day delay, updated around 12 UTC daily. DOI: 10.24381/cds.e2161bac
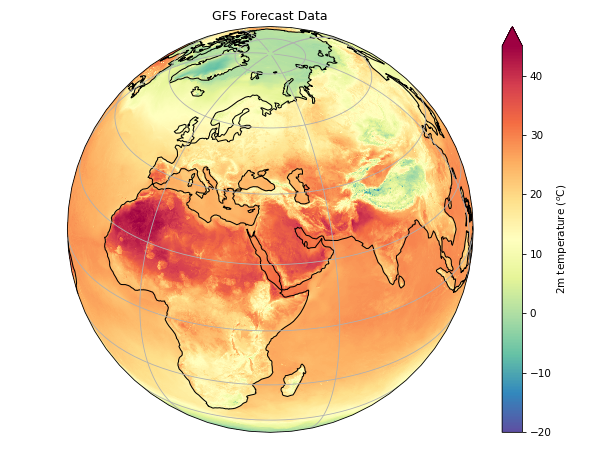
The Global Forecast System (GFS) is a numerical weather prediction model developed and maintained by the National Centers for Environmental Prediction (NCEP). The GFS model provides forecasts on a global scale out to 16 days into the future. Forecast data up to 120h is provided in hourly intervals and in 3-hour intervals from 120h to 384h.
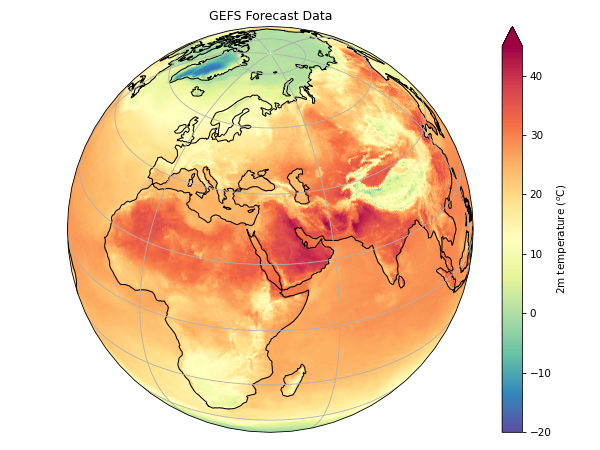
The Global Ensemble Forecast System (GEFS) is an ensemble model developed and maintained by the NCEP, published four times a day. For ensemble data, the values for the control member, the mean and the spread are provided for each requested parameter.
![]()
The ICON (ICOsahedral Non-hydrostatic) model is a global numerical weather prediction (NWP) model developed by the German Weather Service (Deutscher Wetterdienst, DWD). The forecast horizon is +180 hours for the two model runs at 00 and 12 UTC and +120 hours for the other two runs at 06 and 18 UTC. The time interval for the forecast period up to +78 hours is one hour, all other forecast periods beyond +81 hours are covered by a 3-hourly time interval.
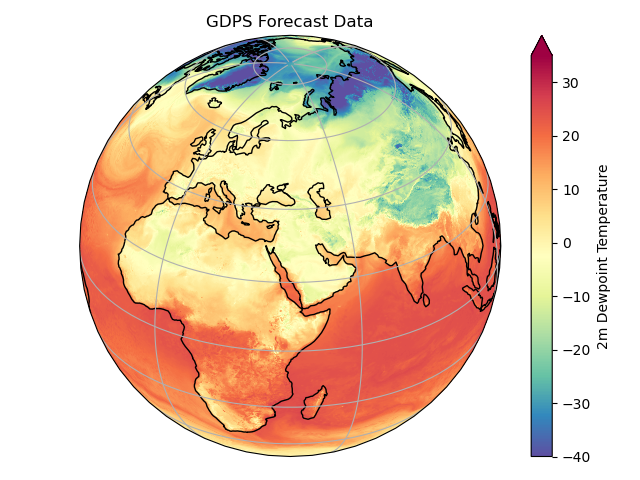
The Global Deterministic Prediction System (GDPS) is a weather model developed and operated by Environment and Climate Change Canada (ECCC).
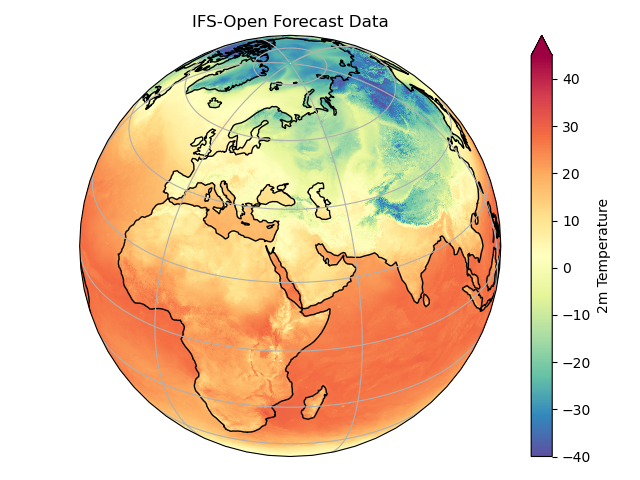
The IFS-OPEN is an open version of the Integrated Forecasting System (IFS) with resolution of 0.25 degrees and 3 hours.
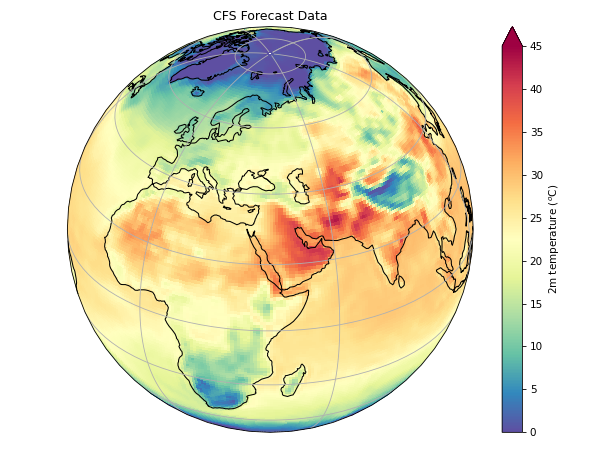
The Climate Forecast System (CFS) is a seasonal forecast model developed by NCEP. The CFS model is designed to predict climate variations on seasonal to interannual timescales, typically spanning weeks to months into the future.
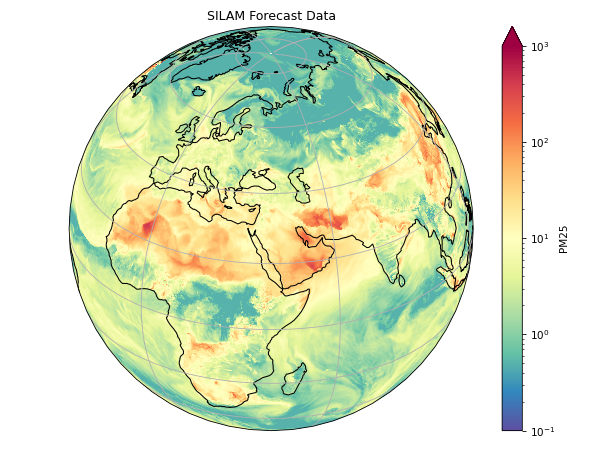
The SILAM (System for Integrated modeLling of Atmospheric coMposition) dataset is a modeling system developed by the Finnish Meteorological Institute (FMI) for simulating and forecasting atmospheric composition, including air quality, aerosols, and chemical species such as ozone, nitrogen dioxide, sulfur dioxide, and particulate matter.
Regional Datasets
Regional weather datasets are suitable for short-term forecasting typically up to 2 days. They have higher resolutions down to about 2.5km. We provide regional models covering CONUS and the EU regions as shown below.
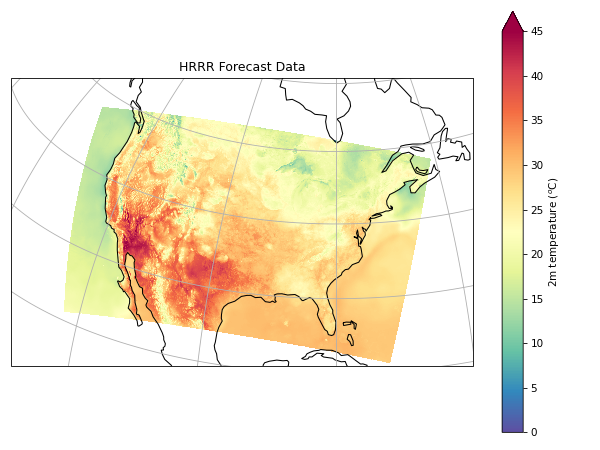
The High-Resolution Rapid Refresh (HRRR) model is a high-resolution numerical weather prediction model developed by the NCEP. HRRRR hourly dataset is published four times a day with forecast out to 48 hours and HRRR-subhourly data is published every hour.
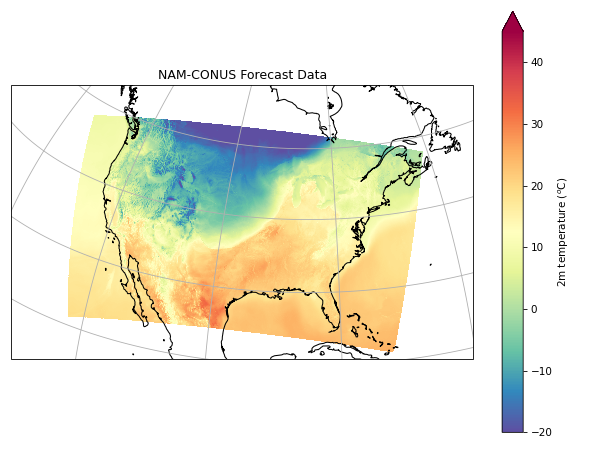
The North American Mesoscale (NAM) one of the NCEP's major models for producing weather forecasts. NAM dataset is published four times a day with forecast out to 60 hours.
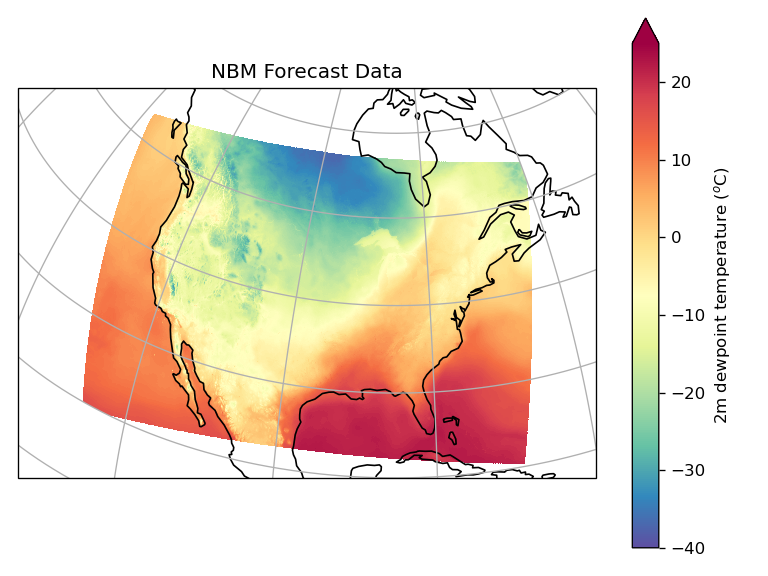
The National Blend of Models (NBM) is a nationally consistent and skillful suite of calibrated forecast guidance based on a blend of both NWS and non-NWS numerical weather prediction model data and post-processed model guidance.
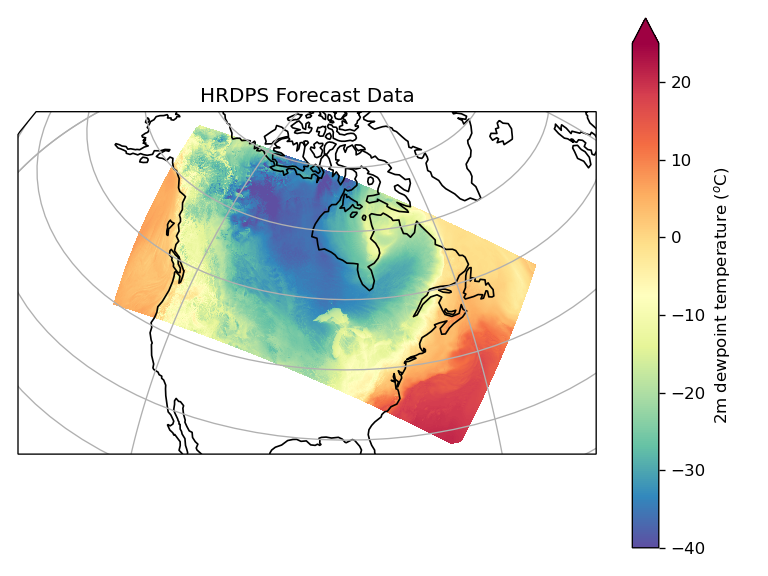
The High-Resolution Deterministic Prediction System (HRDPS) is a numerical weather prediction (NWP) model developed and operated by Environment and Climate Change Canada (ECCC). The HRDPS is specifically designed to provide high-resolution forecasts for regions of Canada.
![]()
ICON-EU is a high-resolution, regional version of the ICON model, tailored for providing high-resolution weather forecasts over Europe. ICON-EU forecasts are generated every 3 hours.
![]()
ICON-D2 is a high-resolution, regional weather forecasting model developed by the DWD, designed for very short-range weather forecasting over smaller areas at a 2.5 km resolution. ICON-D2 model forecast is generated every 3 hours.
We're always adding datasets. If you need something that we don’t currently offer, please feel free to reach out and ask.
| Type | Datasets | Spatial Resolution |
Temporal Resolution |
Coverage / Forecast Horizon |
Update Frequency |
Notes |
|---|---|---|---|---|---|---|
| Historical Reanalysis |
ERA5 ERA5-Land |
28km 9km |
1 hr 1 hr |
1940 - present 1950 - present |
Daily Daily |
Available with 5-day delay |
| Global Forecast |
GFS GDPS ICON IFS-OPEN |
13/25km 15km 13km 0.25 deg |
1 - 3 hrs 3 hrs 1 hr 3 hrs |
16 days 10 days 180 hrs 6 - 10 days |
6 hrs 12 hrs 6 hrs 6 hrs |
1 hr data up to 120h, 3-hr otherwise 120 hrs for 06z and 18z runs |
| Regional Forecast (N.America) |
HRRR NAM-CONUS NBM HRDPS |
3km 3km 3km 2.5km 2.5 km |
1 hr 15 min 1 hr 1 hr 1 hr |
2 days 18 hrs 60 hrs 36 - 264 hrs 48 hrs |
6 hrs 1 hr 6 hrs 1 hr 6 hrs |
Lambert conformal conic projection is re-mapped to regular lat/lon grid |
| Regional Forecast (Europe) |
ICON-EU ICON-D2 |
5km 2km |
1 hr 1 hr |
48 hrs 48 hrs |
3 hrs 3 hrs |
|
| Seasonal Forecast |
CFS | 100km | 6 hrs | 9 months | Daily | |
| Ensemble Forecast |
GEFS | 25km | 3 hrs | 10 days | 6 hrs | |
| Air Quality Forecast |
SILAM | 20km | 1 hr | 5 days | Daily | Includes data from 5 previous days |
Use Cases
Here are some examples of what you can do with Oikolab API:
- Building Simulation - Download TMY or AMY EPW files for any location from 1940 to present.
- Asset Management - Have assets in hundreds of locations? Download time-series weather data for all locations with a single API call.
- Climate Change Analysis - Get decades of weather parameter time-series data in seconds.